
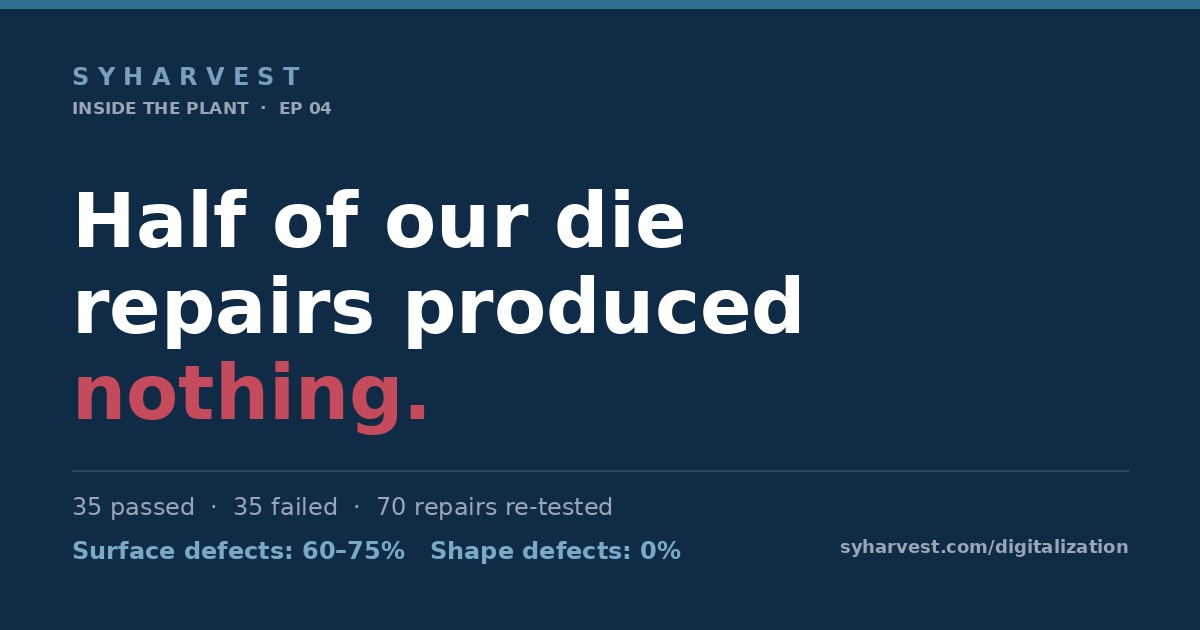
Half of our die repairs produced nothing. We only found out when we started recording whether the repair actually worked — and the split between surface and shape defects turned out to be total.
A die is the most expensive thing in an extrusion plant that nobody can see. It sits in a rack, gets rented out to the press, comes back with a number scratched on the side, and if you are lucky, someone remembers what happened to it last time.
For years that "someone" was a drawer.
Not a metaphor. A physical drawer with maintenance slips in it, and a die-room foreman with thirty years of memory. It worked — until it didn't. Two things broke it: we could not tell a customer how many times their die had been reworked, and we could not tell ourselves which repairs had actually fixed anything.
This is what we changed, and the number that came out of it.
What a die record has to hold
Four things. Anything less and you cannot answer the questions that actually get asked.
| Field | Why it is not optional |
|---|---|
| Die ID + profile code | Without both, a repair cannot be matched to a defect six months later |
| Shots since last polish | Die life is counted in shots, not weeks. This predicts a failure; almost nobody tracks it |
| Repair history: date, defect, level (in-house polish / second-level rework / back to the maker) | The level matters more than the date — see below |
| Outcome of the trial after repair | Without this, a repair is a hope, not a record |
The last one is the one that changed everything. We were recording that we repaired a die. We were not recording whether the repair worked.
One in two
In eight days at the end of October we logged 124 repair batches. Seventy had already been re-tested on the press. Thirty-five passed. Thirty-five failed.
Half of the work we paid for and waited for produced nothing.
We had no idea. The slips were filled in, the foreman was experienced, and the dies came back looking better than they went out. Nobody was counting the ones that failed the trial, because "failed trial" was not a column.
The useful part is not the average. It is the split.
Surface defects can be polished. Shape defects cannot.
| Repair reason | Passed / failed | Rate | What we now write on the repair slip |
|---|---|---|---|
| Streaks | 6 / 2 | 75% | Level 1 (polish) |
| Waving | 3 / 1 | 75% | Level 1 |
| Lines | 3 / 2 | 60% | Level 1 |
| Surface depression | 3 / 5 | 37% | Level 1 — second failure goes to level 2 |
| Out of round | 0 / 3 | 0% | Level 2 or back to the die maker |
| Out of shape / too thick / uneven wall / uneven bottom / bulging / tight fit | 0 / 2, 0 / 2, all 0/1 | 0% | Level 2 or back to the die maker |
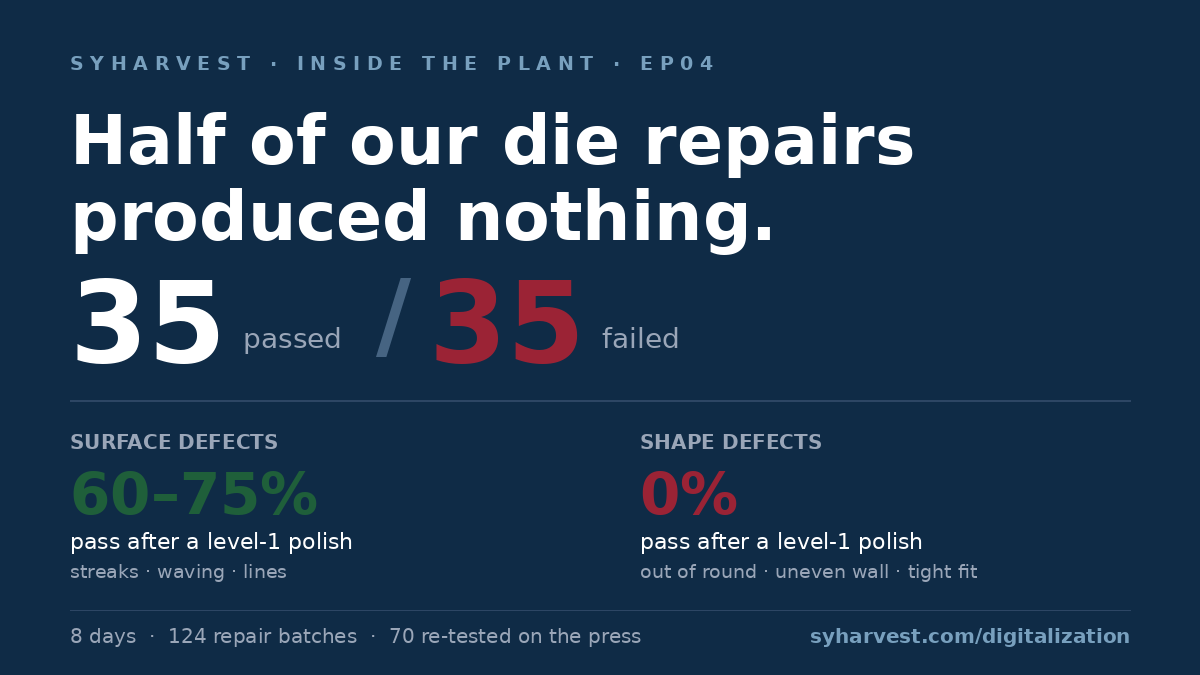
The rule that came out of this table is simple, and it was not obvious to us before: surface problems respond to a level-1 polish. Dimensional and shape problems never do — zero hits, not one.
Every time we sent an "out of round" die for an in-house polish, we paid for a cycle of waiting and got nothing back. We had been doing that for years, because the repair slip had one blank field and the foreman filled it with the only option the plant could offer that evening.
One category deserves its own line: surface depression, at 37%. It sits on the boundary. One repair often works, the second rarely does. So the slip now says: first attempt level 1, second failure goes straight to level 2. Before that rule, we would try a third and a fourth time on the same die, each one costing a cycle.
The same repair, three dies, one night
Because repairs are dispatched in batches, the plant accidentally runs an experiment for us. Three dies go out the same evening for the same defect, come back the same day, and go on the press in the same shift. Same repair method, same time window, same people.
Two passed. One failed.
The conclusion is not "the method doesn't work" — two of three worked. The conclusion is that the third die is the problem: its bearing length, its welding chamber, its heat treatment. No amount of polishing will fix a die whose geometry is wrong.
That is the difference between a repair decision and a replacement decision, and for years we made it by argument. Now we make it by counting.
The vendor question nobody wants to ask
On one day in early November, 13 trial dies: 8 passed, 5 failed — 62% across the plant.
Split by supplier, same day:
| Supplier | Dies | Pass rate |
|---|---|---|
| Vendor A | 7 | 6 / 7 = 86% |
| Vendor B | 5 | 2 / 5 = 40% |
| Vendor C | 1 | 0 / 1 |
The plant average hides a gap of 46 percentage points. More importantly: one customer's new dies had all been placed with Vendor B, and three of those five failed. The number hurting that customer's delivery date was not 62%. It was 40% — and on that customer's own four dies, 25%.
(Sample sizes are small: five dies is a hint, not a verdict. We write the number and the sample size together, and we do not act on a sample below five.)
One family of dies, two suppliers, nine failures
The clearest case we have: one multi-cavity family for a single profile, dies numbered 8, 9 and 11, supplied by two different vendors.
- Die 9 — zero passes in 6 attempts, all "out of round"
- Die 11 — zero passes in 3 attempts, all "tight fit"
- Die 8 — came back for "out of round", still waiting for the press
Nine trials, zero successes, two different vendors, and both failure modes sitting in the 0% zone of the table above.
That is not a repair problem and it is not a vendor problem. That family is wrong by design. The right call is to stop sending it for polishing and decide — with a die engineer, not a foreman — whether to scrap it or open a new one. We spent nine cycles learning that, and the cycles were not free.
What we do now
- Every repair slip carries the defect category, not just "repair".
- Level 1 is only for surface defects. Dimensional and shape defects skip to level 2 or go back to the maker.
- A second failure on the same defect means the die, not the repair. No third in-house attempt.
- A repair is not closed until it has been re-tested on the press and the result is recorded.
- One customer's dies are reviewed as a family, not one at a time. The failure is usually in the family, not the cavity.
What still does not work
- Shots are counted at the die room, not at the press. The number is always one shift late — exactly the shift when a drifting die does its damage.
- Not every die is in the register yet. Moving the remaining ones in is manual, and it competes with everything else in a plant this size.
- We still have no reliable cost per die-life hour. So we cannot yet say whether polishing at 30,000 shots is cheaper than polishing at 40,000. Until we can, "preventive" is a word we use loosely.
Research note
This is a small-N operational dataset: 124 repair events, 70 with a recorded outcome, over eight days, from one plant. It is not a controlled study and it should not be read as one.
What it does suggest is that repair effectiveness is categorical rather than continuous — the same intervention succeeds or fails depending on the failure mode, with almost nothing in between. In our data the split between surface and dimensional defects is total: 60–75% versus 0%. That is a testable claim on a larger sample, and as far as we can tell nobody has published it.
Question for you
If you run a die room: what share of your repairs would pass if you re-tested every one of them?
If you do not know, that is the answer — and it was ours for years.
Interested in Our Products?
Contact us today for a professional quotation tailored to your requirements.
Get a Free Quote